The past data and current data can decide the success of helpdesk teams. Reports help to act proactively by showing trends, gaps and helps for continuous improvements. Accurate KPI, Matrix reports can add tremendous values to teams and overall business.
In this tutorial we will go though some important aspect of RemedyForce Reporting including security.
Remedyforce uses Force.com reporting capabilities. Depending on how your administrator has set up permissions Staff will get access to Reports and Dashboards tab
Key concepts
Reports – A report returns a set of records that meets certain criteria, and displays it in organized rows and columns. Report data can be filtered, grouped, and displayed graphically as a chart. Reports are stored in folders, which control who has access
Dashboards– A dashboard shows data from source reports as visual components, which can be charts, gauges, tables, metrics, or Visualforce pages. The components provide a snapshot of key metrics and performance indicators for your organization.
Report Type– A Report Type defines the set of records and fields available to a report based on the relationships between a primary object and its related objects. Reports display only records that meet the criteria defined in the report type.
Let’s look at the types of Reports
| Type | Use | Totaling | Grouping/ Charts |
Dashboards |
| Tabular | Similar to spreadsheet.
Best for list. |
Single grand total | No grouping.
No charts |
No |
| Summary | Most commonly used. | View subtotal | Grouping of rows of data.
Charts-Yes |
Yes |
| Matrix | Most complex, grid format,
Use when you have large amounts of data to summarize |
Related totals | Grouping by rows and columns.
Charts-Yes |
Yes |
| Joined Reports | Can contain data from multiple standard or custom report types.
You can add report types to a joined report if they have relationships with the same object or objects Upto 5 blocks are possible |
Like Summary reports | Like Summary reports | Yes |
Report creation steps overview at glance
- Select of object , report type
- Add columns for information to be displayed
- Select Report formant
- Specify how fields should be grouped for summary and matrix reports
- Specify filtering criteria if required to select appropriate records
- Add charts in case of summary or matrix reports
- Save and Run
Report type

Use this when you want to get information from two different objects which are related.
- Set of records based on primary and related objects
- Setup>App setup>Create>Report typ
Options for the data
Each “A” record must have at least one related “B” record.
Include all records that have children“A” records may or may not have related “B” records.
Include all records that may or may not have children
Exporting report options
- Printable View – Export report with formatting into Excel. Nice printable view.
- Export Details – Export raw data to excel
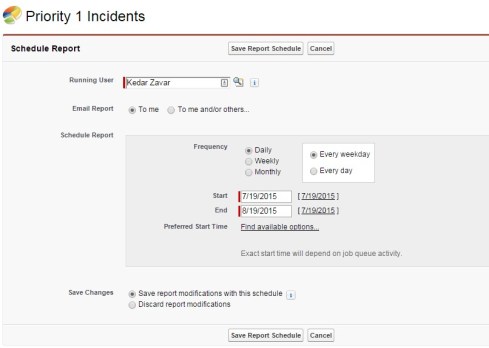
Scheduling reports
You can schedule report runs to daily, monthly or weekly. The email is sent to the users. The access level of the running user determines what other users, see when they receive the scheduled report run results. You can only send emails to users and groups with access to the report folders.
Maximum size of emailed reports is 10 MB so keep these reports limited by adding filters, selecting right date ranges, removing unwanted columns.
Joined reports can’t be scheduled. The emails does not include graphs.
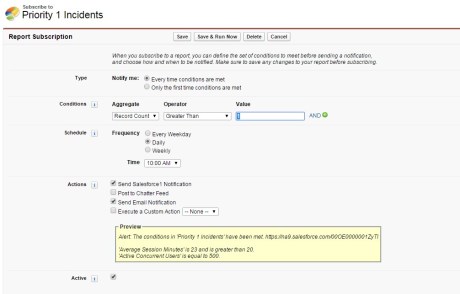
Subscriptions
This is very nice feature to notify selectively based on conditions they are different than Schedule future runs which lets users schedule reports to be emailed at specified times, without specifying conditions.
Subscribe to a report to receive report notifications periodically, when the metrics you care about most meet certain conditions. You can set the conditions that should trigger notification, and specify if you want to be notified via salesforce1 notifications, chatter, or email.
- Enable report notification subscriptions for all users.
Setup | Customize | Reports & Dashboards | Report Notifications
- In-App Notifications
Setup | Mobile Administration | Notifications | Settings
Historical Trend Reporting
There is an option for historical trend reporting. Setup, click Customize | Reports and Dashboards | Historical Trending. You can choose up to eight fields to make available for historical trend reporting.
After you enable historical trending, a new custom report type is available when you create future reports. The historical fields available to each user depend on the fields that user can access.

